Graphical Examples of AMSOL Calculations
A time-saving approximation often made in many calculations in the literature today is that gas phase
wave functions can be used to calculate solution phase properties of molecules. AMSOL, however,
allows the wavefunction to relax in the presence of the solvent. As the following pictures show, the
wavefunction can change dramatically in the presence of the solvent. Thus, the aforementioned
approximation can lead to drastically different (and incorrect) results. Calculations were done using
the AM1-SM2 model and the Spartan graphical visualization program.
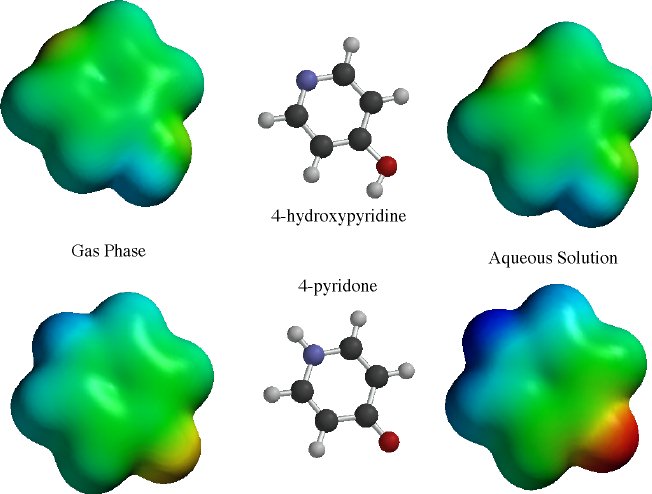
The tautomeric equilibrium between 4-hydroxypyridine and 4-pyridone shifts from favoring
the pyridine in the gas phase to STRONGLY favoring the pyridone in aqueous solution
(the difference in the free energy of solvation between the two tautomers is more than 6 kcal/mol).
The following two slides show that the pyridone is far more polarized by the solvent than is the
pyridine. This leads to a much more favorable solvation free energy.
 This is a plot of the electrostatic potential as computed by Spartan for both 4-hydroxypyridine and 4-pyridone. Red indicates very negative regions and blue indicates very positive regions. On the left are the gas phase results and on the right are the solvated results.
 This is the same system as above, except the electrostatic potential is shown as a series of isopotential surfaces. (Only negative surfaces are shown).
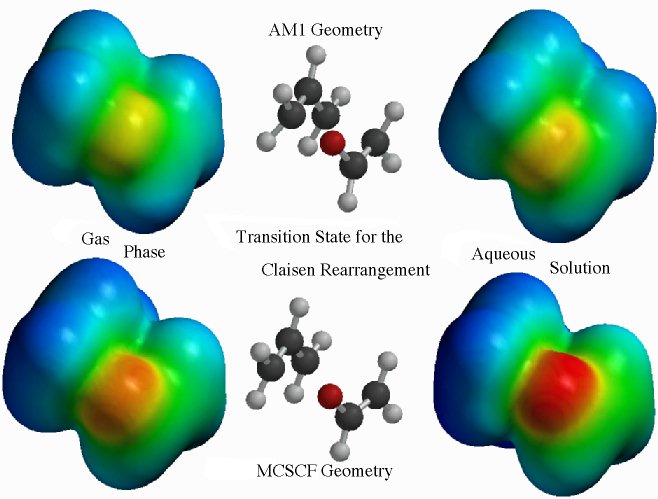
The Claisen rearrangement is another example of a system that behaves differently in solution compared to the gas phase. (See references 7 and 13.) The Claisen rearrangement is an electrocyclic reaction that converts an allyl vinyl ether into an unsaturated aldehyde or ketone via a [3,3] sigmatropic shift. It is estimated by Severence and Jorgensen (J. Am Chem. Soc. 1992, 114, 10966) that the experimental acceleration of this rearrangement upon dissolution in water is about a factor of 1000 at 348K. The following two pictures show 1) the polarization effect of allowing the wavefunction to polarize in solution, and 2) the effect of using higher levels of theory to obtain better transition state structures.
 These plots are of the electrostatic
potential of the Claisen transition state using the graphical program Spartan. On the left are the
gas phase results and on the right are the solution phase results. The top line of pictures
contains the results for the AM1 optimized geometry (which is thought to be too 'tight'). The bottom
line of pictures shows the results using the MCSCF transition state geometry (calculated by the Houk group - J. Am. Chem. Soc. 1994, 116, 12047).
These plots are of the electrostatic
potential of the Claisen transition state using the graphical program Spartan. On the left are the
gas phase results and on the right are the solution phase results. The top line of pictures
contains the results for the AM1 optimized geometry (which is thought to be too 'tight'). The bottom
line of pictures shows the results using the MCSCF transition state geometry (calculated by the Houk group - J. Am. Chem. Soc. 1994, 116, 12047).
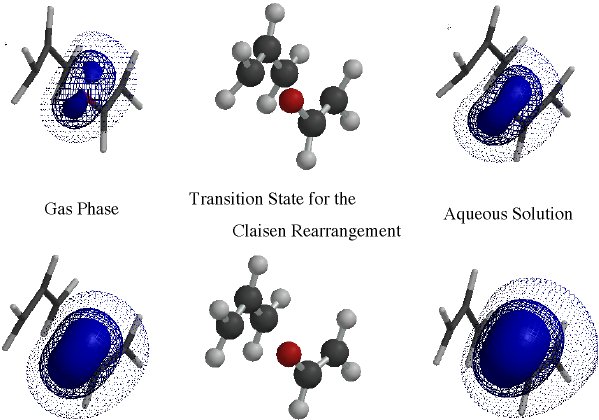
 This is the same system as above except that the electrostatic potential is shown as a series of isopotential surfaces. (Only negative surfaces are shown.)
Return to Table of Contents
 This is a plot of the electrostatic potential as computed by Spartan for both 4-hydroxypyridine and 4-pyridone. Red indicates very negative regions and blue indicates very positive regions. On the left are the gas phase results and on the right are the solvated results.